
Transcription
Prison Policy Initiative
November 25, 2015
Dear Kneyl,
I'm attaching The Boston Globe article about the case you mentioned in your letter. I don't know if you heard that in January, Judge Mark Coven decided to open an inquest into the death of Joshua Messier.
I tried to look for the $3 million settlement for you, but I didn't have any luck. That is very exciting that you've been hearing from The Innocence Project. I wish you the best of luck.
I'm attaching two of our recent reports.
Sincerely,
[redacted]
Benadette Rabuy
Policy and Communications Associate
===
https://www.prisonpolicy.org/reports/income.html
Prisons of Poverty:
Uncovering the pre-incarceration incomes of the imprisoned
By Bernadette Rabuy and Daniel Kopf
July 9, 2015
Press release
Leer en español
Correctional experts of all political persuasions have long understood that releasing incarcerated people to the streets without job training, an education, or money is the perfect formula for recidivism and re-incarceration. While the fact that people released from prison have difficulties finding employment is well-documented, there is much less information on the role that poverty and opportunity play in who ends up behind bars in the first place.
Using an underutilized data set from the Bureau of Justice Statistics, this report provides hard numbers on the low incomes of incarcerated men and women from before they were locked up.
Findings
The findings are as predictable as they are disturbing. The American prison system is bursting at the seams with people who have been shut out of the economy and who had neither a quality education nor access to good jobs. We found that, in 2014 dollars, incarcerated people had a median annual income of $19,185 prior to their incarceration, which is 41% less than non-incarcerated people of similar ages.
The gap in income is not solely the product of the well-documented disproportionate incarceration of Blacks and Hispanics, who generally earn less than Whites. We found that incarcerated people in all gender, race, and ethnicity groups earned substantially less prior to their incarceration than their non-incarcerated counterparts of similar ages:
Figure 1. Median annual incomes for incarcerated people prior to incarceration and non-incarcerated people ages 27-42, in 2014 dollars, by race/ethnicity and gender.
Incarcerated people
(prior to incarceration) Non-incarcerated people
Men Women Men Women
All $19,650 $13,890 $41,250 $23,745
Black $17,625 $12,735 $31,245 $24,255
Hispanic $19,740 $11,820 $30,000 $15,000
White $21,975 $15,480 $47,505 $26,130
Figure 2. Percentage difference between the median annual incomes for incarcerated people prior to incarceration and non-incarcerated people ages 27-42, in 2014 dollars, by race/ethnicity and gender.
Men Women
All 52% 42%
Black 44% 47%
Hispanic 34% 21%
White 54% 41%
While the gap in income is most dramatic for White men, White men have the highest incomes. By contrast, the income gap is smallest for Hispanic women, but Hispanic women have the lowest incomes.
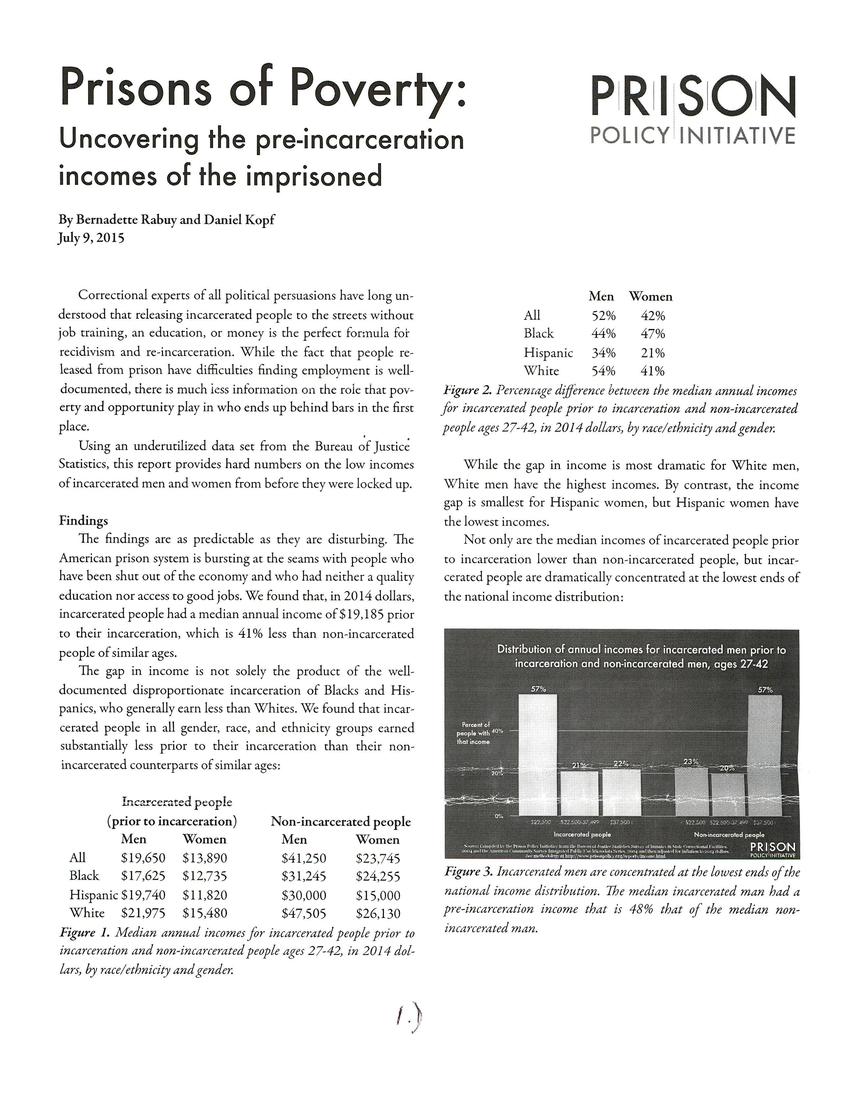
Not only are the median incomes of incarcerated people prior to incarceration lower than non-incarcerated people, but incarcerated people are dramatically concentrated at the lowest ends of the national income distribution:
Figure 3. Incarcerated men are concentrated at the lowest ends of the national income distribution. The median incarcerated man had a pre-incarceration income that is 48% that of the median non-incarcerated man.
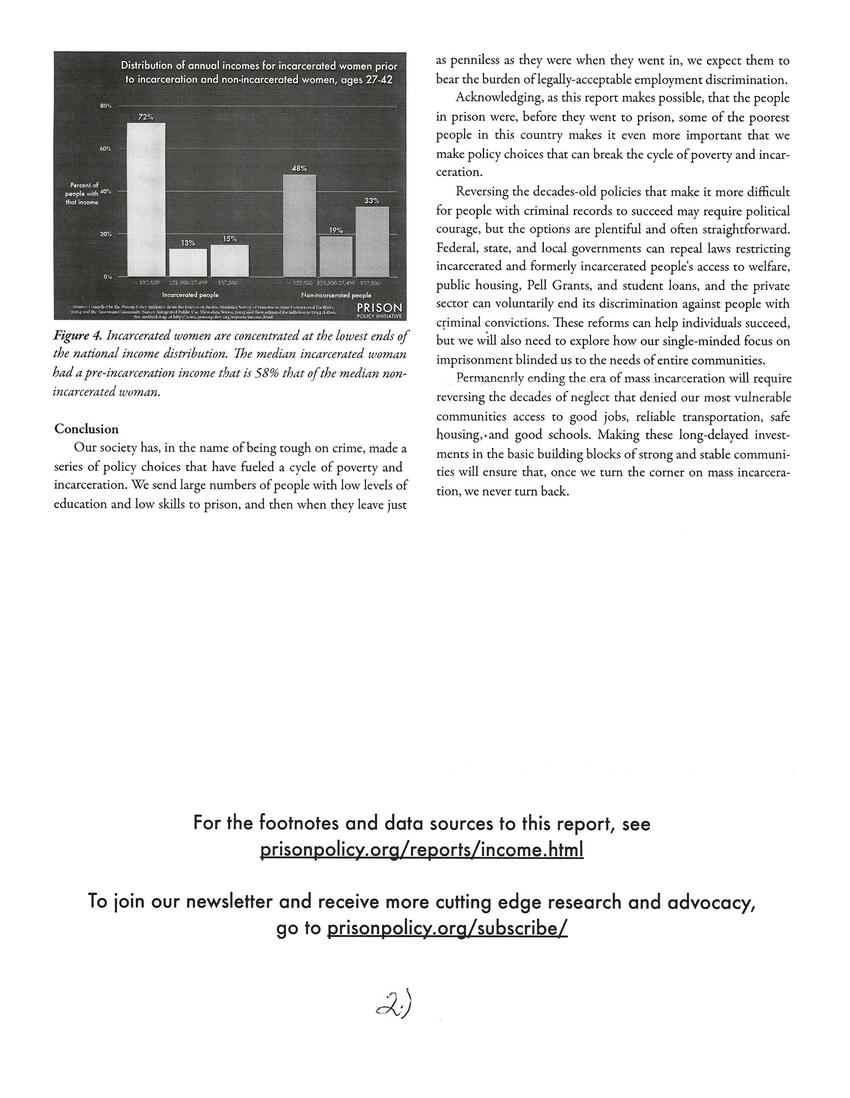
Figure 4. Incarcerated women are concentrated at the lowest ends of the national income distribution. The median incarcerated woman had a pre-incarceration income that is 58% that of the median non-incarcerated woman.
Conclusion
Our society has, in the name of being tough on crime, made a series of policy choices that have fueled a cycle of poverty and incarceration. We send large numbers of people with low levels of education and low skills to prison, and then when they leave just as penniless as they were when they went in, we expect them to bear the burden of legally-acceptable employment discrimination.
Acknowledging, as this report makes possible, that the people in prison were, before they went to prison, some of the poorest people in this country makes it even more important that we make policy choices that can break the cycle of poverty and incarceration.
Reversing the decades-old policies that make it more difficult for people with criminal records to succeed may require political courage, but the options are plentiful.
Reversing the decades-old policies that make it more difficult for people with criminal records to succeed may require political courage, but the options are plentiful and often straightforward. Federal, state, and local governments can repeal laws restricting incarcerated and formerly incarcerated people's access to welfare, public housing, Pell Grants, and student loans, and the private sector can voluntarily end its discrimination against people with criminal convictions. These reforms can help individuals succeed, but we will also need to explore how our single-minded focus on imprisonment blinded us to the needs of entire communities.
Permanently ending the era of mass incarceration will require reversing the decades of neglect that denied our most vulnerable communities access to good jobs, reliable transportation, safe housing, and good schools. Making these long-delayed investments in the basic building blocks of strong and stable communities will ensure that, once we turn the corner on mass incarceration, we never turn back.
Methodology
Background
This is not the first report to address the incomes of incarcerated people. The Bureau of Justice Statistics (BJS) collects this data periodically (most recently in 2004 with another survey scheduled for 2015–2016) but does not routinely publish the results in a format that can be accessed without statistical software. The BJS last published a complete analysis of the survey results in 1993 and used the 2004 data in a narrower study of incarcerated parents of minor children. Sociologists Bruce Western and Becky Pettit used a portion of this same data set in their groundbreaking books and articles on the impact of incarceration on men. Our intent in this report has been to make this data for both men and women available and accessible to the public.
This report was not intended to make the point that incarceration causes poverty, although there is extensive research on that topic (see below for recommended reading). Because the Prison Policy Initiative is regularly asked about the role that poverty plays in who ends up behind bars, this report is aimed at answering a different question: are incarcerated people poorer than non-incarcerated people? In particular, we wanted to address questions like the morality of allowing private telephone companies to charge the families of incarcerated people $1/minute for phone calls home from prisons and jails.
To be clear, this report relies on the Bureau of Justice Statistics survey from 2004, which is both quite old and the newest available. While we look forward to the Bureau of Justice Statistics releasing the raw data from their 2015–2016 survey in two to four years, we know of no reason or trend that would make relying on the 2004 survey less reliable than the alternatives of using data from 1993 or no data at all.
Further research should look at the effects of educational attainment and prior sentences on pre-incarceration incomes and identify policies that could address those disparities.
Data sources and process
This report is the result of a collaboration between Bernadette Rabuy, Policy and Communications Associate at the Prison Policy Initiative, and data scientist Daniel Kopf, who joined our Young Professionals Network in February 2015.
Together, we studied the BJS Survey of Inmates in State Correctional Facilities, 2004 relying in particular on the questions listed below and then developing a way to make the data comparable to non-incarcerated people. Notably, our data only includes the incomes of people incarcerated in state prisons, not federal prisons or county jails.
S7Q11c. Which category on this card represents your personal monthly income from ALL sources for the month before your arrest?
S1Q1a. Sex
S1Q2a. What is your date of birth?
S1Q3a. Are you of Spanish, Latino, or Hispanic origin?
S1Q3c. Which of these categories describes your race?
The non-incarcerated data comes from the Census Bureau's American Community Survey (ACS), specifically from the Integrated Public Use Microdata Series (IPUMS). We used data from 2004 both because this was the same year as the incarcerated survey data, and because the ACS in 2004 included only people in households and did not include prisons and other group quarters. (Given that in 2004, 12% of Black men in their 20s were incarcerated, a data source that included incarcerated people in the "all population" would have resulted in a misleading comparison.)
Because income is correlated with age and because the incarcerated population trends younger than the general U.S. population, we thought it would be most accurate to compare people of similar ages. We limited our study to the 25th and 75th percentiles of ages for incarcerated people (ages 27–42), and we used the same age range for the non-incarcerated population.
To make all of this data more accessible and useful, we converted all data in two ways: We converted monthly incomes to annual incomes by multiplying by 12, and we multiplied each income by 1.25 to adjust for inflation from 2004 to 2014, as provided by the Bureau of Labor Statistics CPI Inflation Calculator. (Because 2015 is not yet over, the 2015 index value is based only on the latest monthly values and therefore will change from month to month.)
In addition, to provide an estimated median income for each incarcerated race/ethnicity/gender group from the BJS "grouped frequency" data, we followed these steps:
Take the distance between the smallest and largest number in the group containing the median
Multiply this number by the following: ( ( (total data points/2) - total data points in groups with lower numbers) / data points in group containing median )
Add lowest number in group containing the median
On definitions
Note that throughout this report, the incomes for incarcerated people are the incomes incarcerated people reported earning before their arrest, not the incomes they earned through prison labor. For incarcerated people and non-incarcerated people, incomes include welfare and other public assistance. For incarcerated people, incomes also include illegal sources of income.
We use "Non-incarcerated" to refer to people in households, and thereby exclude people in group quarters, including people in correctional facilities, psychiatric hospitals, college/university housing, or residential treatment facilities.
Our data on "Blacks" and "Whites," relies on data for Non-Hispanic Blacks and Non-Hispanic Whites. The federal government defines Black and White as races while Hispanic is defined as an ethnicity (and, therefore, it is possible to identify as both Hispanic and White or Hispanic and Black). Our data for both incarcerated people and non-incarcerated people allowed us to avoid overlap by separately talking about Non-Hispanic Whites, Non-Hispanic Blacks, and Hispanics.
Recommended reading and other data sources
Visionary research by sociologists Bruce Western and Becky Pettit has also relied on this same 2004 BJS state prison data set in order to provide a more realistic picture of the plight of young black men in the U.S. Western and Pettit have also utilized data from the other BJS surveys of inmates (Survey of Inmates of Local Jails or Survey of Inmates of Federal Correctional Facilities) and the National Longitudinal Survey of Youth to fill the gap in data left by government sources such as the Census Bureau's Current Population Survey (CPS). The Current Population Survey is the large monthly labor force survey conducted by the Census Bureau, but, because it only considers households, the CPS excludes incarcerated people.
Over the years, Western and Pettit have produced groundbreaking books and articles that were useful starting points for this report, including:
Bruce Western, Punishment and Inequality in America (New York: Russell Sage Foundation, 2006)
Becky Pettit, Invisible Men: Mass Incarceration and the Myth of Black Progress (New York: Russell Sage Foundation, 2012)
Bruce Western and Becky Pettit, "Incarceration & social inequality" Dædalus (Summer 2010)
The Economic Mobility Project and the Public Safety Performance Project, Collateral Costs: Incarceration's Effect on Economic Mobility (Washington, D.C.: The Pew Charitable Trusts, 2010).
Appendix
The 2004 BJS survey asked incarcerated people what their personal monthly income was the month before their arrest. The data in this appendix is presented in monthly incomes and has not been adjusted for inflation.
The following tables and graphs allow for comparisons between the incomes of incarcerated people prior to incarceration and the incomes of non-incarcerated people for each of the income categories that BJS provides respondents in its Survey of Inmates in State Correctional Facilities. The graphs also show that incarcerated people are dramatically concentrated at the lower ends of the national income distribution.
Figure 5. Median monthly incomes for incarcerated people prior to incarceration and non-incarcerated people ages 27-42, in 2004 dollars, by race/ethnicity and gender.
Incarcerated people
(prior to incarceration) Non-incarcerated people
Men Women Men Women
All $1,310 $926 $2,750 $1,583
Black $1,175 $849 $2,083 $1,617
Hispanic $1,316 $788 $2,000 $1,000
White $1,465 $1,032 $3,167 $1,742
Figure 6. Distribution of monthly incomes for incarcerated men prior to incarceration and non-incarcerated men in 2004 dollars, ages 27-42
Figure 7. Proportion of incarcerated men (prior to incarceration) and non-incarcerated men that fall within an income category.
Income category Proportion of incarcerated men with that income
(prior to incarceration) Proportion of non-incarcerated men with that income
$0 1.82% 3.10%
$1-199 3.25% 1.84%
$200-399 7.66% 1.68%
$400-599 8.03% 2.87%
$600-799 7.05% 2.30%
$800-999 8.44% 2.71%
$1,000-1,199 9.39% 3.61%
$1,200-1,499 11.90% 5.07%
$1,500-1,999 10.21% 9.56%
$2,000-2,499 10.63% 10.10%
$2,500-4,999 10.64% 37.11%
$5,000-7,499 4.15% 12.41%
$7,500+ 6.84% 7.64%
Figure 8. Distribution of monthly incomes for incarcerated women prior to incarceration and non-incarcerated women in 2004 dollars, ages 27–42. While most incarcerated people make less prior to incarceration than people on the outside, there is one interesting anomaly in the data for women not present in the data for men. More non-incarcerated women report no income at all than incarcerated women prior to incarceration. For both groups, the reported incomes include wages, welfare, and other public assistance, but since these are individual surveys, they do not include spousal income. It is likely that many of those non-incarcerated women with zero reported income are receiving support from their spouses.
Figure 9. Proportion of incarcerated women (prior to incarceration) and non-incarcerated women that fall within an income category.
Income category Proportion of incarcerated women with that income
(prior to incarceration) Proportion of non-incarcerated women with that income
$0 4.45% 15.42%
$1-199 5.62% 5.04%
$200-399 9.77% 3.86%
$400-599 14.76% 4.94%
$600-799 9.77% 3.82%
$800-999 8.87% 4.22%
$1,000-1,199 9.85% 4.99%
$1,200-1,499 8.56% 5.60%
$1,500-1,999 7.86% 9.93%
$2,000-2,499 5.41% 9.26%
$2,500-4,999 7.13% 25.47%
$5,000-7,499 3.66% 5.21%
$7,500+ 4.30% 2.24%
Footnotes
1. Learn more about the Survey of Inmates in State Correctional Facilities. ↩
2. While the typical non-incarcerated person has at least a high school diploma, the typical incarcerated person does not. Using the same Bureau of Justice Statistics and Census Bureau data sets, we found that the median education of an incarcerated person ages 27–42 is 11 years completed, and the education gap is getting worse. In her book, Invisible Men, Becky Pettit finds that while the overall educational attainment of Americans has grown since 1980, the fraction of the incarcerated with less than a high school diploma grew over this same period. See Becky Pettit, Invisible Men: Mass Incarceration and the Myth of Black Progress (New York: Russell Sage Foundation, 2012), p 16. ↩
3. In the Baltimore community that sends the most people to state prison, Sandtown-Winchester/Harlem Park, more than half of the residents ages 16–64 are not employed. In addition, 61% of Sandtown-Winchester/Harlem Park's residents age 25 and older have less than a high school diploma. See Justice Policy Institute and Prison Policy Initiative, "Sandtown-Winchester/Harlem Park," The Right Investment? Corrections Spending in Baltimore City, February 2015. ↩
4. This is for people imprisoned in state prisons ages 27–42, which are the 25th and 75th percentiles of ages for incarcerated people based on the 2004 BJS survey data. The median annual income for incarcerated people ages 27–42 is $19,185 while the median annual income for non-incarcerated people ages 27–42 is $32,505. The median annual income for incarcerated men ages 27–42 is $19,650 while the median annual income for non-incarcerated men ages 27–42 is $41,250. The median annual income for incarcerated women ages 27–42 is $13,890 while the median annual income for non-incarcerated women ages 27–42 is $23,745. ↩
5. Julia Love, "Apple rescinds policy against hiring felons for construction work," San Jose Mercury News, April 9, 2015. ↩
6. The report, The Right Investment? Corrections Spending in Baltimore City, shows that the home communities of people imprisoned in Maryland's state prisons are places that experience disproportionate unemployment, greater reliance on public assistance, higher rates of school absence, higher rates of vacant and abandoned housing, and more addiction challenges. See Justice Policy Institute and Prison Policy Initiative, The Right Investment? Corrections Spending in Baltimore City (Easthampton, MA and Washington, D.C.: Justice Policy Institute and Prison Policy Initiative, February 25, 2015). ↩
7. Proposed Collection, 80 FR 9749 (Feb 24,2015). ↩
8. Allen Beck et al., Survey of State Prison Inmates, 1991 (Washington, D.C.: Bureau of Justice Statistics, May 1993), p 3. ↩
Lauren E. Glaze and Laura M. Maruschak, Parents in Prison and Their Minor Children, (Washington, D.C.: Bureau of Justice Statistics, March 2010). ↩
9. Learn more about the Survey of Inmates in State Correctional Facilities. ↩
10. Learn more about the U.S. Census Bureau's American Community Survey IPUMS database. ↩
11. See an explanation of who is included in group quarters. ↩
12. See the Bureau of Labor Statistics CPI Inflation Calculator. ↩
===
https://www.prisonpolicy.org/reports/prisonvisits.html
Separation by Bars and Miles:
Visitation in state prisons
By Bernadette Rabuy and Daniel Kopf
October 20, 2015
Press release
Leer en español
Most of today’s prisons were built in an era when the public safety strategy was to “lock ‘em up and throw away the key.” But now that there is growing interest from policymakers and the public to help incarcerated people succeed after release, policymakers must revisit the reality of the prison experience and the false assumptions of that earlier era.
Almost by definition, incarceration separates individuals from their families, but for decades this country has also placed unnecessary burdens on the family members left behind. Certainly in practice and perhaps by design, prisons are lonely places. Analyzing little-used government data, we find that visits are the exception rather than the rule. Less than a third of people in state prisons receive a visit from a loved one in a typical month:
Figure 1. The data on how family ties are maintained in state prison shows that prison visits are rare while the telephone is a more common way of staying in touch. Thankfully, the FCC’s upcoming order to cap the costs of calls home from prisons and jails should increase call volume.
Type/time frame Percent receiving that contact
Personal visit in the past month 31%
Phone in the past week 70%
Despite the breadth of research showing that visits and maintaining family ties are among the best ways to reduce recidivism, the reality of having a loved one behind bars is that visits are unnecessarily grueling and frustrating. As a comprehensive 50-state study on prison visitation policies found, the only constant in prison rules between states is their differences. North Carolina allows just one visit per week for no more than two hours while New York allows those in maximum security 365 days of visiting. Arkansas and Kentucky require prospective visitors to provide their social security numbers, and Arizona charges visitors a one-time $25 background check fee in order to visit. And some rules are inherently subjective such as Washington State’s ban on “excessive emotion,” leaving families’ visiting experience to the whims of individual officers. With all of these unnecessary barriers, state visitation policies and practices actively discourage family members from making the trip. The most humane and sensible government policies would instead be based on respect and encouragement for the families of incarcerated people.
Given the great distances families must travel to visit their incarcerated loved ones, it is inexcusable for states to make the visiting process unnecessarily stressful. Using the same dataset, we find that most people (63%) in state prison are locked up over 100 miles from their families, and unsurprisingly, distance from home is a strong predictor for whether a person in a state prison will receive a visit in a given month.
Locking people up far from home has the unfortunate but strong effect of discouraging visits. We found that among incarcerated people locked up less than 50 miles from home, half receive a visit in a month, but the portion receiving visits falls as the distance from home increases:
Figure 2. Incarcerated people in state prisons report whether they were visited in the past month, by distance from home (in miles)
Distance Percent visited last month
Less than 50 miles 49.6%
Between 50 and 100 miles 40.0%
Between 101 and 500 miles 25.9%
Between 501 and 1,000 miles 14.5%
And while there are a variety of reasons why an incarcerated person might not receive a visit, the fact that most prisons were built in isolated areas ensures hardship on the families of incarcerated people. Studies of incarcerated people in California, Indiana, Maryland, Michigan, Minnesota, New Hampshire, New Jersey, New York, Ohio, South Dakota, and Tennessee found that distance is a top barrier preventing them from in-person contact with their families.
Millions of families are victims of mass incarceration, and policymakers are starting to understand that. Having established that large distances discourage visitation, this report makes several recommendations for how the U.S. criminal justice system can support — rather than punish — the families of incarcerated people. States should:
Use prison time as an option of last resort.
Understanding how putting great distances between incarcerated people and their families is often damaging, states should implement alternatives to incarceration that can keep people home or closer to home such as Washington State’s Family and Offender Sentencing Act, which allows judges to waive prison time and instead impose community custody for some primary caregivers of minor children. At the same time, states’ criminal justice policies should match their rhetoric of decarceration. States such as California, Colorado, Connecticut, Hawaii, Mississippi, New Jersey, New York, South Carolina, and Texas should recognize that they have been able to successfully reduce both imprisonment and crime and lead the rest of the nation by closing remote prisons.
Eliminate and refrain from adopting visitation policies that dehumanize families and actively encourage visitation.
States should recognize that incarceration is often an emotional and vulnerable time for families and should actively encourage visiting by making the prison environment as comfortable as possible. States such as California and Massachusetts should stop their unnecessary and dehumanizing strip and dog searches of visitors. States can enact family-friendly visitation programs such as the children’s center in New York State’s Bedford Hills Correctional Facility and Oakland Livingston Human Service Agency’s program in Michigan that allows incarcerated fathers to have several hour-long visits with their children with room for activities. In the short-term, states can make visits more comfortable for families with children by making crayons and coloring books available.
Willingly cooperate with the Federal Communications Commission’s upcoming prison and jail telephone regulations, and have the courage to reduce the costs to families even further. Stop making other forms of communication exploitative.
Fortunately, the Federal Communications Commission (FCC) is finally poised to end $1-per-minute phone calls from prisons and jails with its strong proposal to regulate local, intra-state, and inter-state calls as well as ancillary fees. The FCC will be encouraging states to view these rate caps as a federal ceiling. States can and should reduce the costs to families even further, and states such as Arkansas and Indiana should stop fighting the regulations. Further, states should avoid implementing video visitation as a replacement for in-person visits — as has been done in hundreds of local jails throughout the country — and avoid overly restrictive mail policies like those of the New Hampshire Department of Corrections that ban children’s drawings and greeting cards.
Listen to the recommendations of incarcerated people and their families who can best identify the obstacles preventing them from staying in touch during incarceration.
Families have long been saying that no matter how much they would like to visit and see firsthand that their loved ones are safe, sometimes the money and time required make visiting incarcerated loved ones virtually impossible. The sad reality is that currently, a majority of incarcerated parents of minor children do not receive visits from any of their children during their prison sentence. Recognizing that their families are often the main source of hope for people during their incarceration and the main source of support upon release, correctional facilities should gather and seriously consider family input when making decisions about visitation and communication policies.
Implement programs that assist families who want to visit.
The costs of visitation and communication literally drive some families of incarcerated people into debt. States should consider implementing free transportation to prisons as the New York State Department of Corrections and Community Supervision did before budget cutbacks in 2011. Departments of Corrections should also consider video visitation as a supplement to in-person visits, especially for remote prisons. The Oregon Department of Corrections first implemented video visitation as a supplement to traditional visits in its two most remote prisons, and it has since expanded the technology to prisons throughout the state. States can also easily model video visitation programs after that of the Mike Durfee State Prison in South Dakota where, for 12 hours every week, incarcerated people have access to free video visits using Skype.
When faced with prison overcrowding, explore sentencing and parole reforms instead of prison expansion and out-of-state transfers.
Often, when states are faced with prison overcrowding, they adopt band-aid fixes like sending people to out-of-state prisons where they will be even further from their families. More effective solutions are to first adopt low-hanging fruit reforms such as reducing the aging prison population or allowing primary caregivers to serve their sentences in the community, and then to explore larger-scale sentencing and parole reforms.
Appendix
Using the Bureau of Justice Statistics’s 2004 Survey of Inmates in State Correctional Facilities, we found the breakdown of how far people in state prisons reported being locked up from their home communities. The table below provides estimated counts for the total U.S. state prison population based on the responses of the 14,500 people imprisoned in state prisons who responded to the BJS survey.
To get this data, we relied on the question: S7Q6c. How far from this prison is … where you were living at the time of your arrest? Is it less than 50 miles, between 50 miles and 100 miles, between 101 and 500 miles, between 501 and 1,000 miles, or more than 1,000 miles?
Figure 3. How far incarcerated people in state prisons are imprisoned from their homes (in miles)
Distance Count Proportion
Less than 50 miles 184,041 15.7%
Between 50 and 100 miles 244,981 20.9%
Between 101 and 500 miles 623,011 53.2%
Between 501 and 1,000 miles 92,356 7.9%
More than 1,000 miles 26,017 2.2%
Methodology
The Bureau of Justice Statistics collects visitation and distance from home data periodically as a part of its Survey of Inmates in State Correctional Facilities, but BJS does not routinely publish the results in a format that can be accessed without statistical software. The Bureau of Justice Statistics published data on how far incarcerated parents of minor children are from their children in Parents in Prison and Their Minor Children. We prepared this report to focus on people imprisoned in state prison in general.
This report relies on the Bureau of Justice Statistics survey from 2004, which is the newest available. The next survey is being conducted in 2015–2016 with the data to be available several years later. While 2004 is older than we would like, we know of no reason or trend that would make visitation data from the 2004 survey an unreliable reflection of visitation today, in 2015.
For this report, we used the Survey of Inmates in State Correctional Facilities’s questions about the location of pre-incarceration homes as a proxy for where family and community ties are located. We used the following questions from the Survey:
S7Q6c. How far from this prison is … where you were living at the time of your arrest? Is it less than 50 miles, between 50 miles and 100 miles, between 101 and 500 miles, between 501 and 1,000 miles, or more than 1,000 miles?
S10Q7a. Are you allowed to talk on the telephone with friends and family?
S10Q7b. In the past week, how many telephone calls have you made or received? Do not include calls to or from a lawyer.
S10Q8a. In the past month, have you had any visits, not counting visits from lawyers?
S10Q8c. Were you allowed to have any visits?
Acknowledgments
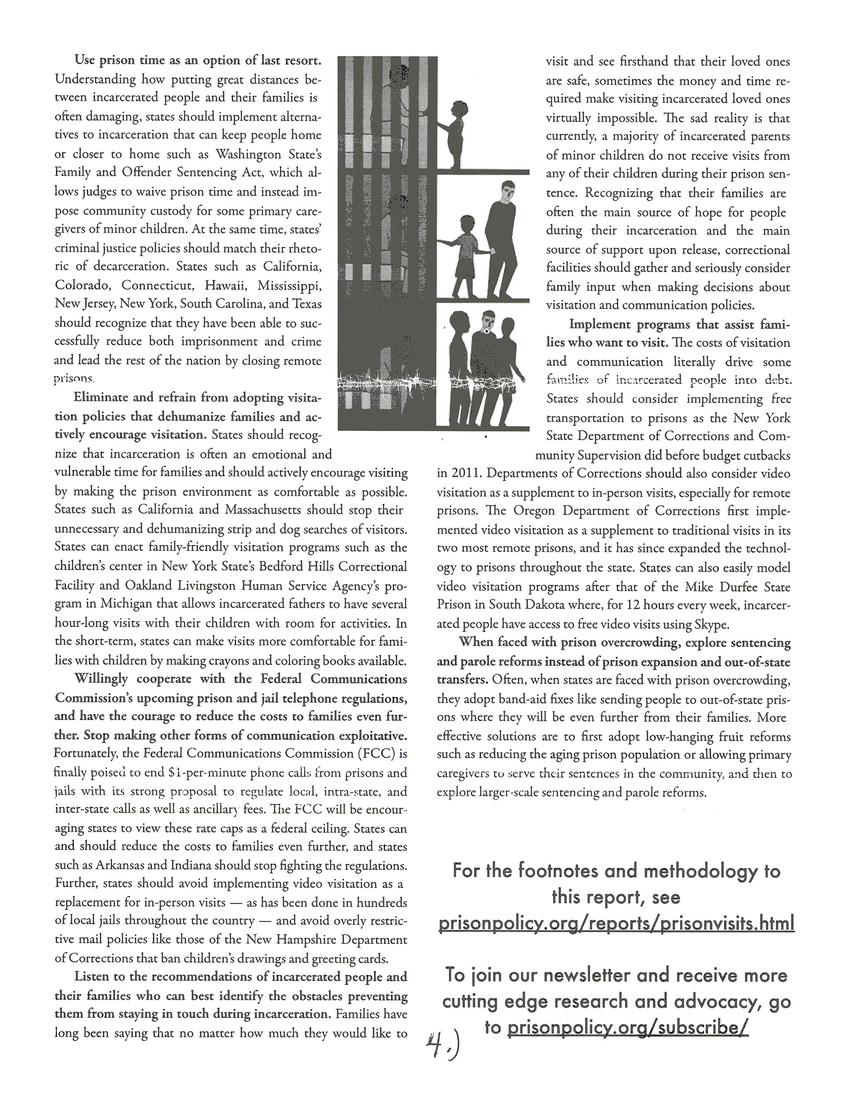
Thank you to Elydah Joyce for the illustrations depicting the emotional toll caused by incarceration.
Footnotes
We used data from the Bureau of Justice Statistics’ 2004 Survey of Inmates in State Correctional Facilities. More information is available here: http://www.bjs.gov/index.cfm?ty=dcdetail&iid=275. ↩
Our analysis is based on people who were permitted to talk on the phone and permitted to have visits in a given month. The survey we used did not include meetings with lawyers as “visits.” ↩
A rigorous Minnesota Department of Corrections study found that a single visit reduces recidivism by 13% for new crimes and 25% for technical violations, and an Ohio Department of Corrections study found that more visits were associated with fewer rule violations. See: Minnesota Department of Corrections, The Effects of Prison Visitation on Offender Recidivism (St. Paul, MN: Minnesota Department of Corrections, November 2011). Accessed on October 14, 2015 from: http://www.doc.state.mn.us/pages/files/large-files/Publications/11-11MNPrisonVisitationStudy.pdf. See also: Gary C. Mohr, An Overview of Research Findings in the Visitation, Offender Behavior Connection (Columbus, OH: Ohio Department of Rehabilitation and Correction, 2012). Accessed on October 16, 2015 from: http://www.asca.net/system/assets/attachments/5101/Mohr%20-%20OH%20DRC%20Visitation%20Research%20Summary.pdf?1352146798. ↩
The study focused on policy directives (detailed rules promulgated by correctional administrators), but there are two more layers that govern prison visitation not included in the study: administrative regulations (general grants of rulemaking authority to correctional administrators) and facility-specific rules (applicable to specific prisons and usually more detailed than policy directives yet not always comprehensive). See: Chesa Boudin, Trevor Stutz, and Aaron Littman, “Prison Visitation Policies: A Fifty State Survey” Yale Law & Policy Review Vol 32:149 (March 2014), 157-166. ↩
Requiring social security numbers can deter family members who are not legal citizens from visiting. ↩
See the visitor’s guidelines for Monroe Correctional Complex for an example: http://www.doc.wa.gov/facilities/prison/mcc/docs/mccvisitguidelines.pdf. ↩
The practice of incarcerating people far from their families is is not an inevitable outcome of incarceration. States and the Bureau of Prisons could choose to place incarcerated people in prisons that are closer to their families. For example, New Jersey’s 2010 Strengthening Women and Families Act led to N.J. Rev. Stat. § 30:4-8.6 (2014), which requires that the Department of Corrections Commissioner make every effort to assign incarcerated women to the prisons closest to their families and Fla. Stat. § 944.171(4) (2015) states that, as much as possible, the department should consider the proximity of a prison to an incarcerated person’s family when making placements. See: New York Initiative for Children of Incarcerated Parents, “Fact Sheet: Proximity to Children when a Parent is Incarcerated,” The Osborne Association, 2013. Accessed on October 2, 2015 from: http://www.osborneny.org/images/uploads/printMedia/ProximityFactSheet_OA2013.pdf. Unfortunately, there has been a trend away from the Bureau of Prisons honoring judges’ recommendations on prison placements to ignoring these recommendations. The Bureau of Prisons should consider judges’ assessments of those who are sentenced and make its best attempt to honor recommendations to keep people closer to home. See: Federal Bureau of Prisons, Legal Resource Guide to the Federal Bureau of Prisons 2014 (Washington, DC: U.S. Department of Justice, 2014), p 12. Accessed on October 14, 2015 from: https://www.bop.gov/resources/pdfs/legal_guide.pdf. See also: S. David Mitchell, “Impeding Reentry: Agency and Judicial Obstacles to Longer Halfway House Placements” Mich. J. Race & L. Vol 16:235 (2011). ↩
“Riding the Bus: Barriers to Prison Visitation and Family Management Services” describes the visiting experience for New York State families based on 200 hours of observation of family support group meetings, attendance at activities aimed at families of incarcerated people, and observation of five bus rides to two upstate New York prisons. See: Johnna Christian, “Riding the Bus: Barriers to Prison Visitation and Family Management Services” Journal of Contemporary Criminal Justice Vol 21:31 (February 2005). ↩
See Appendix. ↩
In a 2010 study by the Department of Health and Human Services, incarcerated fathers reported distance to the prison as the top barrier to contact. See: Office of the Assistant Secretary for Planning and Evaluation, Parenting from Prison: Innovative Programs to Support Incarcerated and Reentering Fathers (Washington, D.C.: U.S. Department of Health and Human Services, April 2010). Accessed on October 8, 2015 from: http://aspe.hhs.gov/basic-report/parenting-prison-innovative-programs-support-incarcerated-and-reentering-fathers. See also a New York State-specific study: NYS Division of Criminal Justice Services, Children of Incarcerated Parents in New York State: A Data Analysis (Albany, NY: NYS Division of Criminal Justice Services, 2013). Accessed on August 18, 2015 from: http://www.criminaljustice.ny.gov/pio/2013-children-with-inarcerated-parents-report.pdf. ↩
Criminologists William D. Bales and Daniel P. Mears found that visitation reduces and delays recidivism. As a result, they recommended placing incarcerated people close to their home communities as one low-cost policy option. See: William D. Bales and Daniel P. Mears, “Inmate Social Ties and the Transition to Society: Does Visitation Reduce Recidivism?” Journal of Research in Crime and Delinquency Vol 45:287 (2008), 315. A Minnesota Department of Corrections study recommended that if — as this report finds — there is a significant relationship between visitation and distance, states such as Minnesota should seriously consider distance from home when placing incarcerated people in particular prisons. See: Minnesota Department of Corrections, 2011, p 31. ↩
This is no doubt a positive reform, but states should go even further by expanding eligibility to include parents who might not have custody of their children. States should also consider allowing judges the discretion to impose community custody for people with past violent offenses. For more on Washington State’s Family and Offender Sentencing Alternative, see: http://www.doc.wa.gov/community/fosa/ ↩
Public Safety Performance Project, “Most States Cut Imprisonment and Crime,” The Pew Charitable Trusts, November 10, 2014 from: http://www.pewtrusts.org/en/multimedia/data-visualizations/2014/imprisonment-and-crime. See also: Lauren-Brooke Eisen and Inimai Chettiar, The Reverse Mass Incarceration Act (New York, NY: The Brennan Center for Justice at the New York University School of Law, October 2015), p 10. Accessed on October 14, 2015 from: https://www.brennancenter.org/sites/default/files/publications/The_Reverse_Mass_Incarceration_Act%20.pdf. ↩
Paige St. John, “California steps up prison drug screening for visitors and staff,” Los Angeles Times, March 3, 2015. Accessed on October 14, 2015 from: http://www.latimes.com/local/political/la-me-ff-california-steps-up-prison-drug-screening-for-visitors-and-staff-20150303-story.html. ↩
Meghan E. Irons, “Prison visitors irate about plan for drug-sniffing dogs,” The Boston Globe, March 23, 2013. Accessed on October 14, 2015 from: http://www.bostonglobe.com/metro/2013/03/22/visitors-could-soon-face-random-narcotics-dogs-sniff-state-prisons/BPTYlAFi6vuwghlfPM1GsN/story.html. ↩
For more information on New York State’s children’s centers, visit The Osborne Association website: http://www.osborneny.org/programs.cfm?programID=11. See also: Tanya Krupat, Elizabeth Gaynes, and Yali Lincroft, A Call to Action: Safeguarding New York’s Children of Incarcerated Parents (New York, NY: The New York Initiative for Children of Incarcerated Parents, The Osborne Association, 2011), p 33. Accessed on August 27, 2015 from: http://www.osborneny.org/NYCIP/ACalltoActionNYCIP.Osborne2011.pdf. ↩
Krupat, Gaynes, and Lincroft, 2011, p 34. ↩
Peter Wagner, “FCC commissioners reveal details of their proposal to protect all families of incarcerated people,” Prison Policy Initiative, October 1, 2015. Accessed on October 19, 2015 from: http://www.prisonpolicy.org/blog/2015/10/01/clyburn-proposal/. ↩
In 2013 New York Department of Corrections and Community Supervision Acting Commissioner Anthony J. Annucci submitted a letter to the Federal Communications Commission explaining that when New York State eliminated the commission in its phone contract and substantially reduced the rate to families, the number of calls rose from 5.4 million calls in 2006 to over 14 million in 2013, it improved the relationship between the Department and “offender advocacy groups,” and it lowered the rate of illicit cell phone use. He called prison phone reform “among the most cost-effective family reunification options that we offer.” See: http://www.prisonpolicy.org/phones/NYDOCCSletter.pdf. In total, the Federal Bureau of Prisons and ten states have banned commissions. See: https://www.prisonphonejustice.org/. ↩
Securus Technologies v. FCC (Docket No. 13-1280, D.C. Cir. 2015) ↩
Jeremy Blackman, “Prison tightens mail policy in effort to curb drug influx,” Concord Monitor, April 13, 2015. Accessed on April 30, 21015 from: http://www.concordmonitor.com/home/16462117-95/prison-tightens-mail-policy-in-effort-to-curb-drug-influx. States should also avoid letter ban policies, which — as our February 2013 report found — have been implemented in local jails across the country. Leah Sakala, Return to Sender: Postcard-only Mail Policies in Jails (Easthampton, MA: Prison Policy Initiative, February 7, 2013). Accessed on October 19, 2015 from: http://www.prisonpolicy.org/postcards/. ↩
For example, Echoes of Incarceration is an award-winning documentary initiative produced by youth with incarcerated parents. In their first film, four youth of incarcerated parents describe how their parents’ incarceration has impacted them: https://www.youtube.com/watch?v=r0HooqTwh_4&feature=youtu.be. ↩
It is especially difficult for incarcerated people and their families to afford the costs associated with visits because they are some of the poorest families in this country. Our report, Prisons of Poverty: Uncovering the pre-incarceration incomes of the imprisoned, found that, in 2014 dollars, incarcerated people had a median annual income of $19,185 prior to their incarceration, which is 41% less than non-incarcerated people of similar ages. See: Bernadette Rabuy and Daniel Kopf, Prisons of Poverty: Uncovering the pre-incarceration incomes of the imprisoned (Easthampton, MA: Prison Policy Initiative, July 9, 2015). Accessed on September 3, 2015 from: http://www.prisonpolicy.org/reports/income.html. ↩
Based on the same dataset as this report, the Bureau of Justice Statistics found that only 42% of parents of minor children imprisoned in state prison received a personal visit from their children since admission. Lauren E. Glaze and Laura M. Maruschak, Parents in Prison and Their Minor Children, (Washington, D.C.: Bureau of Justice Statistics, August 2008), p 6. Accessed on October 14, 2015 from: http://www.bjs.gov/content/pub/pdf/pptmc.pdf. ↩
A recent report found 34% of the families studied fell into debt from simply paying for phone calls and visits with their incarcerated loved ones. See: Saneta deVuono-powell, Chris Schweidler, Alicia Walters, and Azadeh Zohrabi, Who Pays? The True Cost of Incarceration on Families (Oakland, CA: Ella Baker Center, Forward Together, Research Action Design, September 2015), p 30. Accessed on September 15, 2015 from: http://ellabakercenter.org/sites/default/files/downloads/who-pays.pdf. ↩
The Prison Policy Initiative has extensively researched correctional video visitation in the U.S., finding that, ironically, while video visitation would be most useful in state prisons given the remote locations of such facilities, the technology is far more prevalent in local jails. Unfortunately, local sheriffs and private companies have been replacing in-person visits with video visits rather than giving families another option to stay in contact. See: Bernadette Rabuy and Peter Wagner, Screening Out Family Time: The for-profit video visitation industry in prisons and jails (Easthampton, MA: Prison Policy Initiative, January 2015). Accessed on September 3, 2015 from: http://www.prisonpolicy.org/visitation/. ↩
Les Zaitz, “New technology helps Oregon inmates stay connected,” The Oregonian, September 12, 2012. Accessed on September 3, 2015 from: http://www.oregonlive.com/pacific-northwest-news/index.ssf/2012/09/new_technology_helps_oregon_in.html. ↩
See: http://doc.sd.gov/adult/facilities/mdsp/. ↩
Holly Kirby, Locked up and Shipped Away: Interstate Prison Transfers & the Private Prison Industry (Austin, TX: Grassroots Leadership, November 18, 2013). Accessed on October 14, 2015 from: http://grassrootsleadership.org/locked-up-and-shipped-away. See also: Daniel Rivero, “These states’ prisons are so full that they have to ship inmates thousands of miles away,” Fusion, June 8, 2015. Accessed on October 14, 2015 from: http://fusion.net/story/146671/these-states-prisons-are-so-full-they-have-to-ship-inmates-thousands-of-miles-away/. ↩
More information is available here: http://www.bjs.gov/index.cfm?ty=dcdetail&iid=275. ↩
Lauren E. Glaze and Laura M. Maruschak, Parents in Prison and Their Minor Children, (Washington, D.C.: Bureau of Justice Statistics, August 2008), p 6. Accessed on October 14, 2015 from: http://www.bjs.gov/content/pub/pdf/pptmc.pdf. ↩
Proposed Collection, 80 FR 9749 (Feb 24, 2015). ↩
Other posts by this author
|
2016 aug 2

|
2016 mar 20

|
2016 mar 3

|
2016 mar 3

|
2015 nov 15

|
2015 nov 15

|
More... |
Replies